In research papers, tables and figures can be helpful and even necessary to support your argument or to present a clearer, fuller picture of your topic. Creating effective tables and figures is not a simple task, however, and using a table or figure made by another author has intellectual property considerations. In today’s post, I’ll provide some information about tables and figures and some tips for including them correctly and thoughtfully .
Tables
Tables present numerical or non-numerical data in rows (across) and columns (down). They are useful to present lots of information, precise values, and data sets. Microsoft Excel is a common tool to create tables, but many specific data programs are out there for use depending on your field of study.
Get a free sample proofread and edit for your English document.
Two professional proofreaders will proofread and edit your English document.
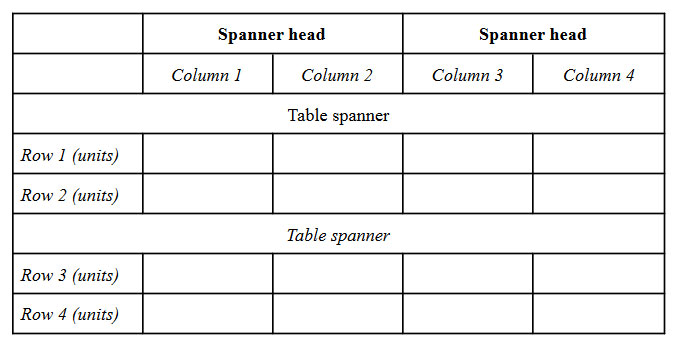
A table should have a concise title and should effectively use gridlines and consistent text formatting (e.g., bold for headings, italics for designations). Rows and columns are labeled with heads (or headings), and multiple rows or columns can be grouped and labeled together with spanner heads. Whole sections can be described with a table spanner. Units for numerical data (e.g., %, km) should be included in the relevant head, and numerical data should be rounded or not consistently.
Tables should be referred to and discussed in the body of the paper, not just plopped in. The idea is that table augments the reader’s understanding of the text by allowing them to view textual data in different ways. This may allow easy comparison of outcomes, a way to emphasize similarities and differences, an easy reference, or whatever benefits the text.
Table 1. Example showing table terminology
Figures
Figures are neither body text nor tabular information and may include graphs, photographs, charts, diagrams, and more. Graphs are useful to demonstrate trends or relationships in sets of data. Diagrams show processes and parts of a whole. Images/photographs allow readers to visualize in detail something specific.
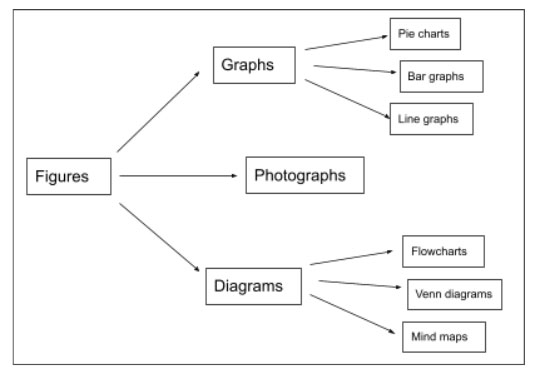
Figures should have a concise, descriptive title (or caption, depending on your style guide) and, like tables, should be referred to and discussed in the body of your paper. See Figure 1 below for a common orientation of figure elements.
Figure 1. Sample figure showing common types of figures
Note: Notes or citations for figures are placed here. Same goes for tables, if a note is needed. Information placed in notes is generally double-spaced like the body of your paper.
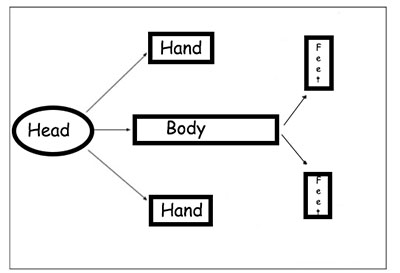
Stick Figure 1. Sample stick figure showing common types of stick figures
Tips and Considerations
Tables and figures can add to or detract from your paper. Follow the tips below to ensure your paper is best enhanced by additions of tables and figures.
Hopefully, this post is enough to get you started with tables and figures, but as abovementioned, make sure to see your style guide for more nuanced rules you may need to apply.
Sarah P.
Get a free sample proofread and edit for your English document.
Two professional proofreaders will proofread and edit your English document.
Get a free sample proofread and edit for your document.
Two professional proofreaders will proofread and edit your document.
We will get your free sample back in three to six hours!


© 2010 - 2020 ProofreadingPal LLC - All Rights Reserved.